The Missing One Thousand

Last summer was a scorcher, and like so many Kiwis, you decide to pack your loved ones and your wares into your car in an effort to cool off at the local break. After an arduous journey and a bit of slip slop and slap, you finally get your cheeks sandy in a bit of paradise. Here, if you went to one of the 74 patrolled beaches across the motu, such as Muriwai or Mount Maunganui, you may see the ubiquitous red and yellow flags wavering with the wind alongside some suitably uniformed yellow lifeguards manning said flags.
But while beaches have become more popular and packed, especially immediately after lockdown, lifeguarding has not. If lifeguarding had kept pace with population growth, we ought to have 1,000 more lifeguards at our beaches than we do now. So, where have they gone?

Figure 1: New Zealand is missing 1,000 volunteer lifeguards.
This three part series will argue that the ubiquity of surf lifeguarding has been in decline for the past 15 years, coinciding with declines in volunteering more broadly, as well as major demographic changes across the motu. Part 1 will explore some key statistics and demographic changes possibly affecting Surf Lifesaving New Zealand (SLSNZ). Part 2 will focus more broadly on the wider economics of volunteering and its effect on the pathway to becoming a lifeguard. Part 3, though not fully fleshed out, will hopefully impart some data-driven and evidence-based solutions to increasing the uptake of lifeguarding in NZ.
Surf lifeguards have been part and parcel of the Kiwi summer for over 100 years. It ought to go without saying - but a lot goes on behind the scenes for lifeguards to bring a “safe” beach environment to you. Lifeguarding is more than just pretending to be David Hasslehoff between the flags - the primary interaction between public and lifeguard. At Muriwai, those on flags are supported by a large cohort standing ready in the tower, who themselves are supported by SurfCom, and we all benefit from the wider support of club members who fix the IRBs, and family who so often keep us fed on patrol.
However, in the last 15 years, lifeguarding hasn’t kept pace with demographic changes in New Zealand, and the workload of the average volunteer lifeguard is increasing. In 2006, we had 1.104 lifeguards per 1000 Kiwis. By 2021, this had fallen to 0.902. Within the same timeframe, the average patrolling hours per lifeguard jumped from 36 to 52. That’s two full extra days of patrols - however I should note the length of the patrolling season has increased since 2006.

Figure 2: NZ Population data has been sourced from the NZ Census and Stats NZ population estimates.

Figure 3: Total patrol hours have grown 42.2% between 2006 and 2021
But what are we getting for all these increased patrolling hours? Well, lifeguards have been undertaking a marked increase in preventative actions, such as educating the public about rips and staying between the flags. Like in medicine, prevention is better than a cure - and the PAs are certainly working. The total rescues for 2021 are less than a third of 2006’s, as shown below:

Figure 4: Total PAs have a CAGR of 0.67%, whilst Total Rescues has had a -7.58% CAGR over the same period.
But hey, do we really need more lifeguards when rescues have been falling over this period? The answer to this strawman is still a resounding yes. Every year, trained lifeguards, both past and present, on-duty or off, have been on site to save distressed surfers and swimmers. I genuinely believe increasing the pool (pun-intended) of trained, undercover lifeguards is worth saving even one life.
There could be several reasons why the total (volunteer) lifeguards have remained largely flat in the past 15 years. These reasons include the rise and strength of the paid lifeguard service, lack of funding, and a decline in volunteering as a whole across New Zealand. I’ll explore those later.
I will instead posit that lifeguarding clubs failing to keep up with demographic changes within their own community as a significant factor. Understanding a club’s own local demographics is the first step in finding our missing lifeguarrds.
Here comes the fun - firstly the methodology:
I primarily used Alteryx to compile my analysis in the following steps:
I geolocated all SLSNZ clubs and created their respective centroids.
I then import the 2018 Census data at the Statistical Area 1 (SA1) level, using the “Spatial Match” tool to join SLSNZ club centroids to the SA1 spatial objects.
Using the “Find Nearest” tool, I define a “community” as any of the SA1s within a 5KM (Euclidean distance) of a club centroid. This tool is superior to the “Trade Area” tool as it avoids overlapping catchments and double counting.
From here, the value and metric engineering began, analysing demographics both across the 2018 and 2006 censuses, and between the “community” and the wider local area of the club, which I defined as being one of the 68 territorial authorities in which the club was located within.
SLSNZ Framework and Data Quality
For the unacquainted, SLSNZ is the parent organisation overlooking surf lifesaving across all of New Zealand. SLSNZ is then split into four administrative regions, each with slightly different operational frameworks. Within each region lies the club. At the risk of generalising, clubs operate independently of each other and SLSNZ, but SLSNZ provides a level of funding and overarching support, such as SurfCom during patrols. The Four Regions are:
Northern Region - 18 Clubs stretching from Cape Reinga to Raglan, 10 of which are in Auckland.
Eastern Region - 19 Clubs covering the East Coast of the Upper North Island, starting from Hot Water Beach moving all down to Poverty Bay.
Central Region - 19 Clubs covering the central North Island; starting in Taranaki and the Hawkes Bay right through to the Capital.
Southern Region - 18 Clubs encompassing the entire South Island.
All SLSNZ Data has been sourced independently from SLSNZ’s respective annual reports. Being a lifeguard myself, I have confidence in the accuracy of the data, as there is a meticulous amount of paperwork (now mostly digitised, thankfully!) that gets documented and reported to SLSNZ. Lifeguards sign-in and sign-out of every patrol, carefully documenting their patrol hours. While I suspect rescues are documented accurately, I suspect PAs are under-reported. Given limited resources, I have not crossed-referenced any of the 74 clubs’ individual annual reports for data.
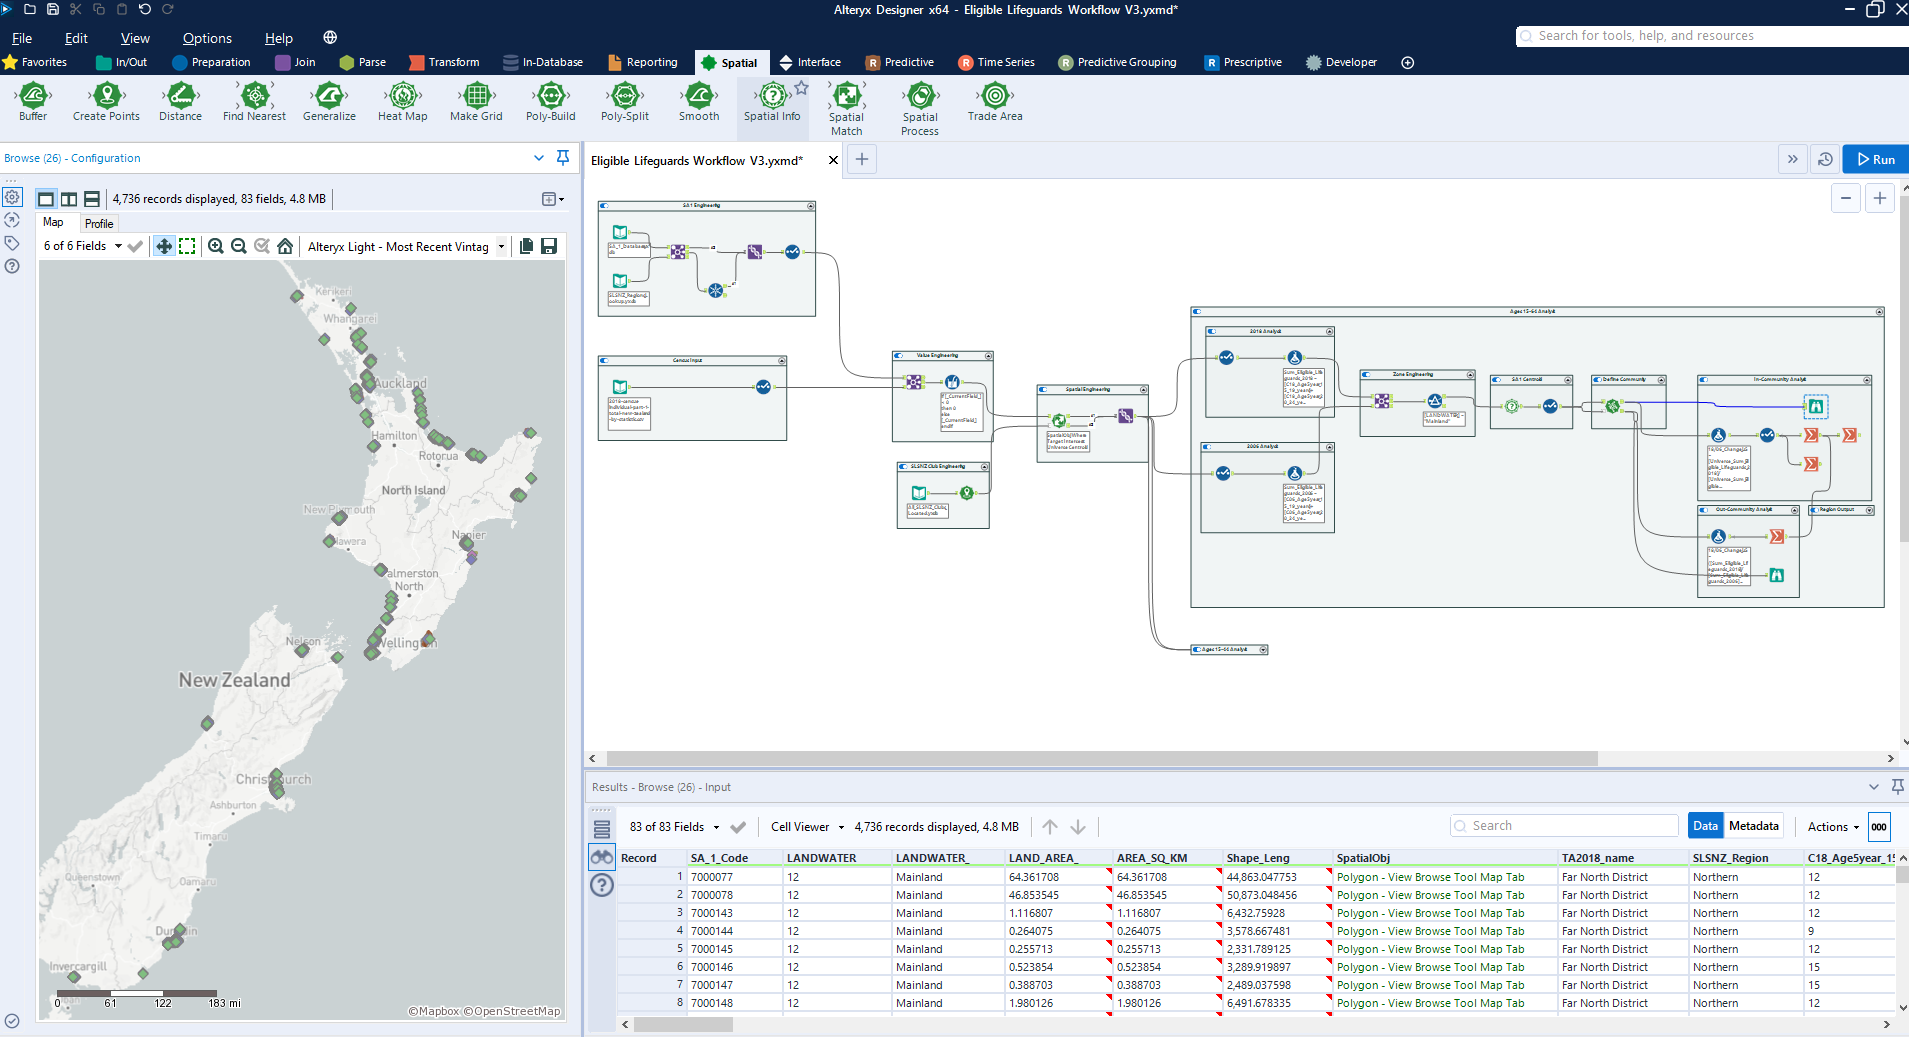
Figure 5: Snapshot of the Alteryx Workflow
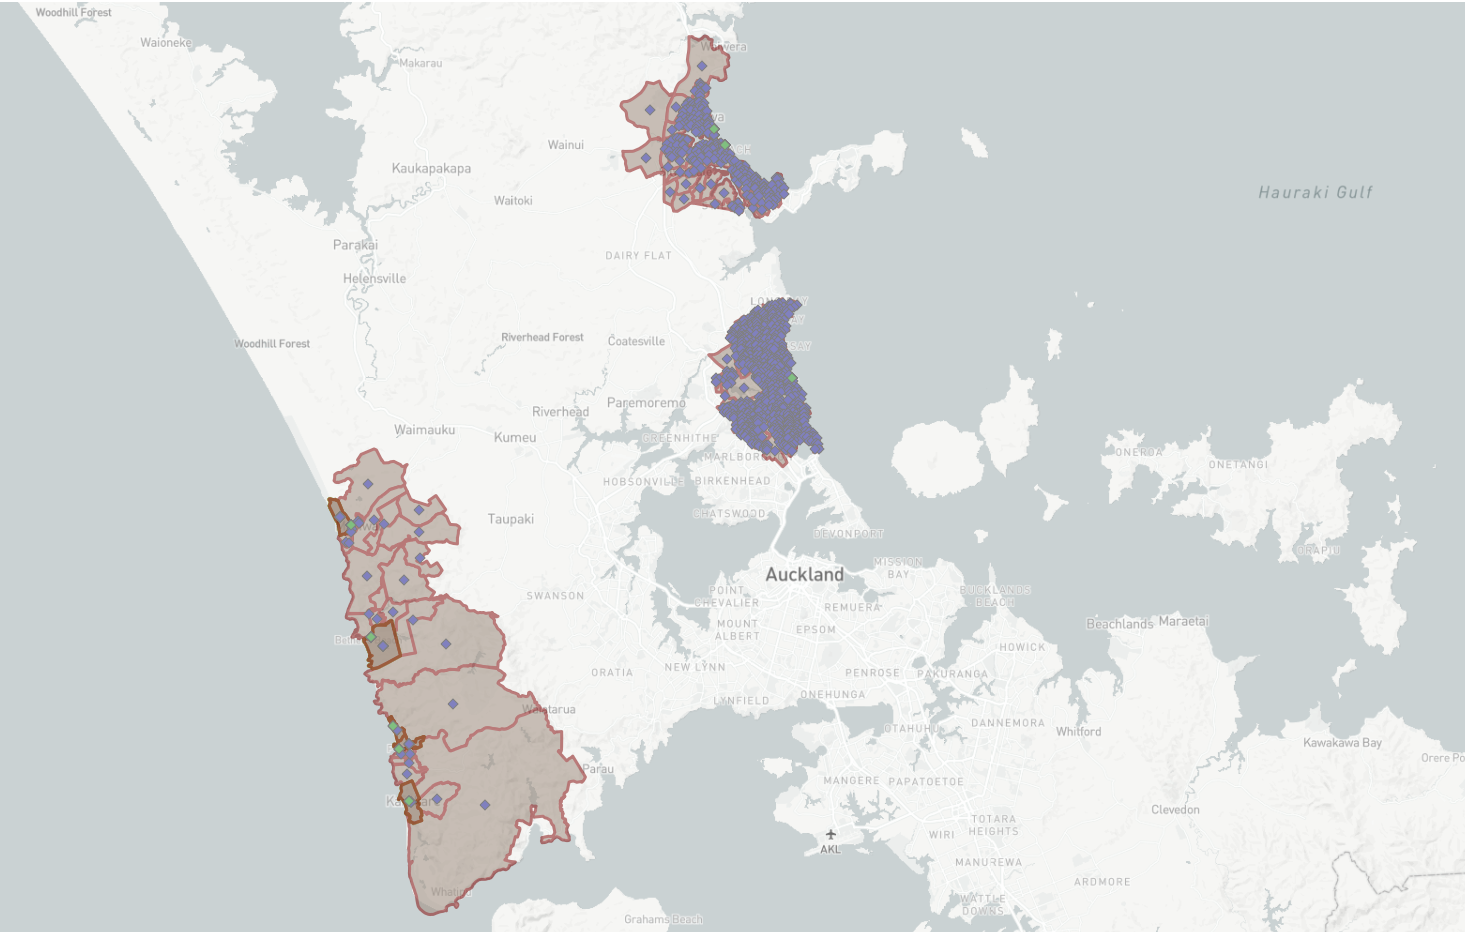
Figure 6: The Auckland SLSNZ Clubs and their respective 5KM radius SA1 “Community”
A Demographic Time Bomb? The elephant in the room
New Zealand is increasingly ethnically diverse, yet SLSNZ clubs remain predominantly European. The New Zealand Search and Rescue (NZSAR) recognises that volunteering in this area is over-indexed by Europeans, and the changes in demographics will have a profound impact on the effectiveness of volunteer-rescue operations. As at the 2018 Census, NZ Europeans make up 70% of the population. By 2038, it is expected NZ Europeans will make up “only” 60% of the population.

Figure 7: Ethnic breakdown within volunteer rescue organisations, 2008. Source: Volunteering New Zealand 2019
Figure 7 shows that SLSNZ is over indexed in European membership and under-indexed everywhere else in 2018. Based on anecdotal experience, not a lot has changed in 2021. I cannot recall another Chinese, or Chinese-speaking lifeguard at Muriwai or anywhere in the Northern Region.
There’s a lot of research around why people volunteer, and a particularly strong motivation behind volunteering is the “sense of community”. I won’t go into too much of it here, but will save the “motivations” research for part 2 of this series.
If we assume clubs get the bulk of their membership base from their local 5KM “Community”, then we can see it is actually becoming harder to address this over-indexing. In all but the Eastern SLSNZ Region, the clubs respective communities have become more European between 2006 and 2018. Essentially, more Europeans live by the beach.

Figure 8: The Northern Region Club “Communities” have seen a 31% decrease in the non-European share of the population between 2006 and 2018.

Figure 9: Changes in Ethnic Diversity between 2006 and 2008 within the Northern SLSNZ Region
Next, let’s compare the 2018 demographic makeup of the 5KM community against that of the wider local area. In all but the Central SLSNZ Region, the coastal “community” is less diverse than that of the wider community level.

Figure 10: Coastal areas in the Northern Region are significantly less diverse than elsewhere in their respective territorial authority.
What I find interesting is the disparity within the Northern Region. It is significant, but I have chosen to retain the same methodology for assessing the wider community level as being the Territorial Authority. Hence, I am comparing the 5KM-radius “community” of say Piha with all of Auckland. Perhaps I could compare it with the pre-2010 borders of the various Auckland region councils, such as the Waitakere City for Piha.
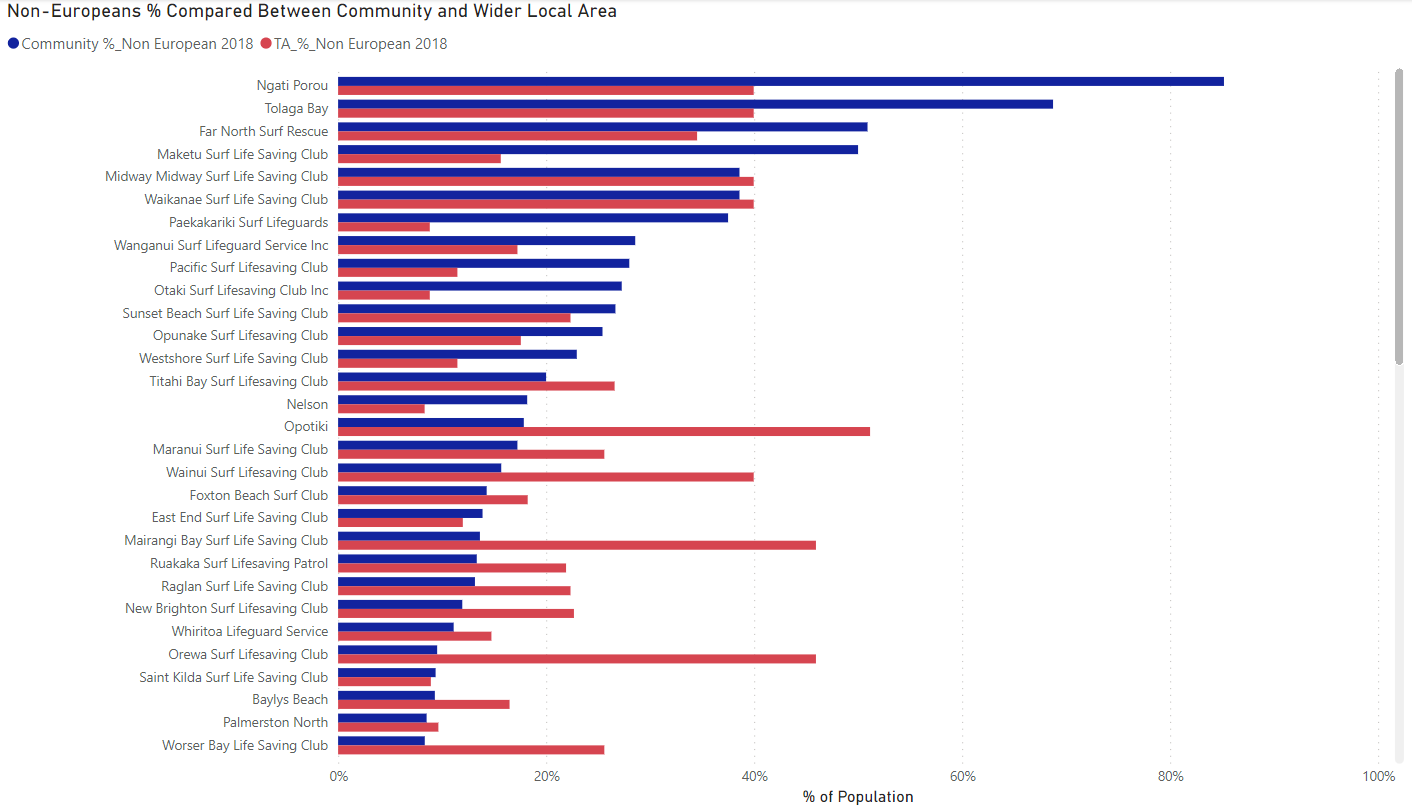
Figure 11: Comparing the diversity between a club’s “community” and their wider community.
Why does this matter?
The NZSAR has written about the benefits of diversity in the volunteer rescue space here. Basically it boils down to a more diverse workforce being able to offer better ability to cope with rapid changes.
It is also an issue of societal trust. According to the HBR, people are more likely to trust others if they are of the same perceived social group. As a lifeguard, I have seen and been the benefit of diversity - when my fellow lifeguards struggled to explain beach safety and then subsequent first-aid to a family from Hong Kong, I managed to step in and explain everything in Cantonese. I have also seen the lack of diversity being a hurdle. I have told members of the public not to enter the water wearing their cultural attire, as it will make them more likely to need rescuing. Honestly - my lack of cultural awareness there probably did more to hinder my message and sew annoyance, than any benefit for beach safety.
I will caveat that diversity and representation aren’t the most important factors in lifeguarding. Having the right training, right attitude, and being fit is arguably more important. Lifeguarding should be a meritocracy of the young and fit - our goal is to keep the beach safe, after all. It should be no surprise that those who live closest to the beach and have the most opportunities to train these skills often make the best lifeguards at the individual level. Nevertheless, at the organisational level, New Zealanders would benefit from a patrol that looked more like them.
But What’s Stopping Non-Europeans from Becoming Lifeguards?
As far as lifeguards go, I am an anomaly. I’m of Cantonese descent, and live very far from the Muriwai community. I joined Muriwai VLS because I had a friend who competed in the boat racing team, I was then young and fit, I could run and swim, and thought heck, I might as well give it a shot. I fell into immediately, and have never looked back.
But I’m privileged that I have had the means to lifeguard. I had parents who taught and encouraged me to swim, I have access to a car, I have the time to volunteer because I earn enough to support myself, I keep fit, I had the right network of friends, and surprisingly, I also enjoy the outdoors.
That last point sounds surprisingly, but the New Zealand Recreation Association found outdoor participation rates differ between ethnic groups due to different constraints and community-defined priorities. For example, Asian migrants identified costs, time, transport and “nobody to go with” as key constraints. Instead, the research says Asian migrants tend more to family and socialising.
For Asian would-be Lifeguards, I think the “nobody to go with” is the highest hurdle to cross. Asian households typically have high incomes and can afford the privilege of teaching their kids to swim and have the means of transport. Yet, based on the data, we see that Asian New Zealanders typically don’t live close to the beach, and therefore do not feel sufficiently connected with any of the lifesaving community to participate. They also probably live in areas where they are unlikely to encounter other lifeguards organically, either through school, church or other social groups. Nevertheless, because surf lifesaving has been predominantly European for so long, even “having someone to go with” can still be bit of culture shock when one first joins a club.
By 2043, Asian New Zealanders are expected to make up 26% of the population. A large number of the missing and growing deficit of lifeguards will undoubtedly found within the Asian community. SLSNZ just needs to find a way to tap into the talent.
The Recruitment Pool
Continuing with the sense of c ommunity thought, I also wanted to find out just how many people within the community could serve as a lifeguard. My analysis is at the highest-level, I have taken everyone aged between 15 and 59 as being eligible lifeguards. I don’t consider any other test of eligibility such as fitness and attitude.
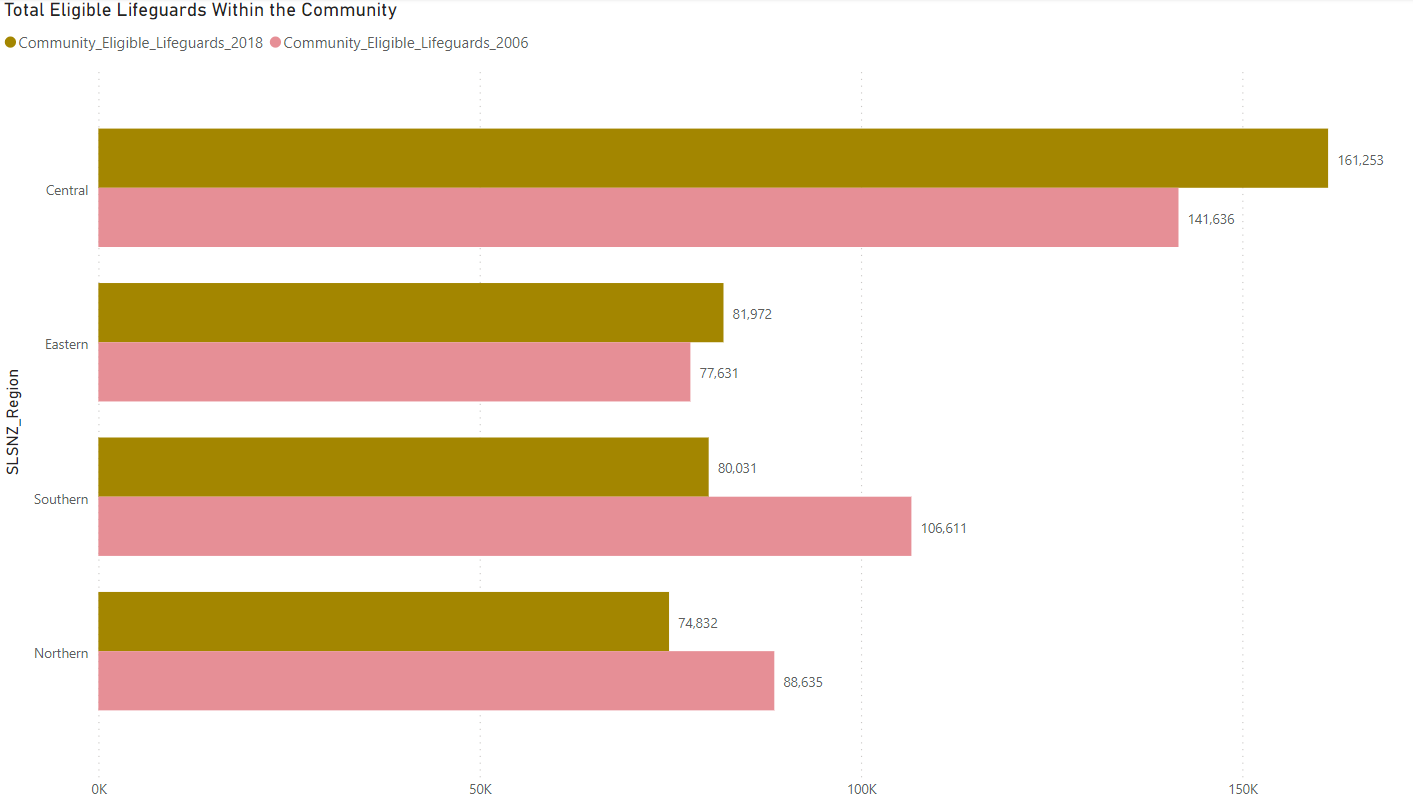
Figure 12: The total population aged between 15-59 resident in a SA1 zone within 5KMs of a SLSNZ Club between 2006 and 2018
Only two SLSNZ regions saw an increase in the total pool of eligible lifeguards within their respective club communities, whilst the others regions fell. I found this quite surprising initially. I suspect this may have something to do with increasing urbanisation across New Zealand; a lot of patrolled beaches aren’t near an urban centre. However, Auckland’s population grew 22% between 2006 and 2018, yet Auckland’s most metropolitan surf lifesaving club, Mairangi Bay, actually saw the number of eligible lifeguards within their 5KM community fall between the two periods.

Figure 13: SLSNZ Northern Region Club “Communities” struggling to grow their pool of eligible lifeguards
I suspect two intertwining factors play into the lack of growth in the recruitment pool. Essentially the old are moving in, and the young are moving out, or can’t afford to move back in with their new families.
Firstly, older, wealthier folk tend to retire close to the beach. I have discounted those over the age 60 and over as being eligible lifeguards, but at a hunch, probably the same group that actively move near beaches when approaching retirement.
Secondly, housing intensification isn’t happening in the areas close to the beach. Even lifeguards who grew up in the community, are probably buying and building houses closer to the CBD. This takes young families, with potentially eligible and trained lifeguards away from the community, thus detaching a strong motivation for volunteering.
I will be taking a deeper dive into how urbanisation affects the economics of volunteering and more specifically, lifeguarding in the next section.
The Takeaway
By my calculation, New Zealand is missing 1,000 lifeguards from our shores. Not only that, the lifeguarding community is increasingly out of kilter with what New Zealand looks like.
The three key takeaways from this section are: firstly, that SLSNZ and its clubs need to have a serious look at how they can recruit lifeguards from outside their community. Secondly, lower the barriers of entry (but not fitness/training requirements) for non-European lifeguards. Thirdly, making more concerted efforts at bringing former lifeguards, who now live away, back into the fold.
These observations aren’t meant to be a criticism of SLSNZ by any means. SLSNZ and the wider surf lifesaving community achieves so much with, often, so little. I thank all lifeguards past, present and future who have worked tirelessly to build upon SLSNZ’s highly esteemed reputation of keeping our beaches safe.
Stay tuned for Part II - which will focus on the economics of volunteering as a whole and how it affects surf lifesaving.
Feel free to message me if you’d like to look into the analysis further or have any suggestions or corrections!